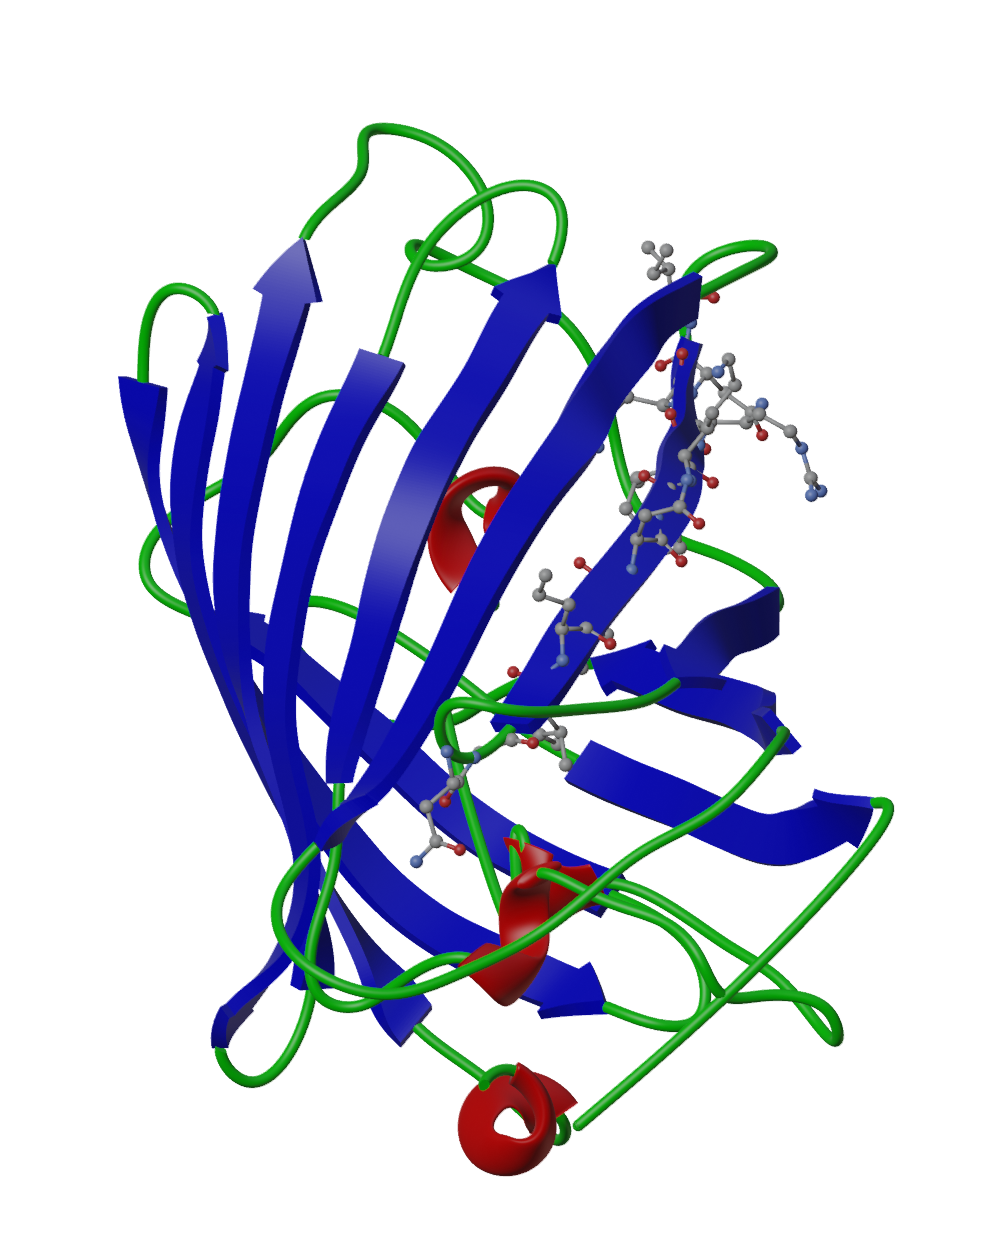
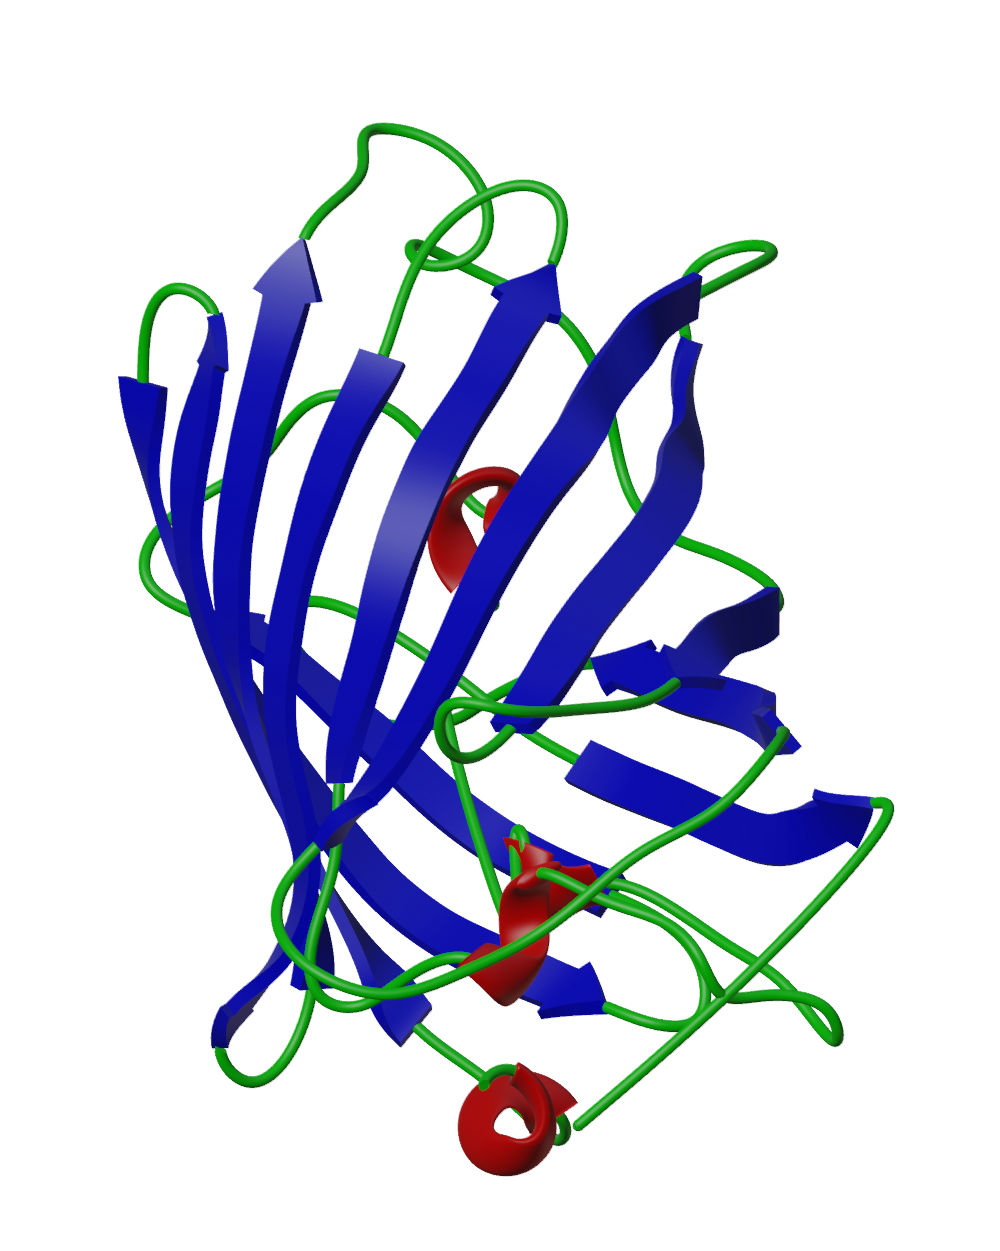
Ribbon diagram
Ribbon diagrams are 3D schematic representations of protein structure. The Ribbon object controls various settings related with ribbon diagram. Here are the secondary structures that supported:
α helix
β sheet
turn
HETATM (ligands, solvent …)
Import a PDB file
You can import a PDB data direct from the website Protein Data Bank (RSCB) by:
from batoms.plugins.rscb import rscb_import
protein = rscb_import("1ema")
Or you can read a local pdf file downloaded by yourself:
from batoms.pdbparser import read_pdb
atoms = read_pdb("test/datas/1tim.pdb")
protein = Batoms("1tim", from_ase = atoms)
Draw ribbon diagram
protein.ribbon.draw()
Selections
You can select the secondary structures, and make change to them. For exmaple, show the atoms for a secondary structure by:
sel1 = protein.selects.add("sel1", "sheet A-160-A-170")
sel1.show = True
sel1.model_style = 1