Volumetric data and isosurface
The Isosurfacesetting object is used to store and set all parameters related with volumetric data. It should always bind with a Batoms object. Possible keywords are: level, color.
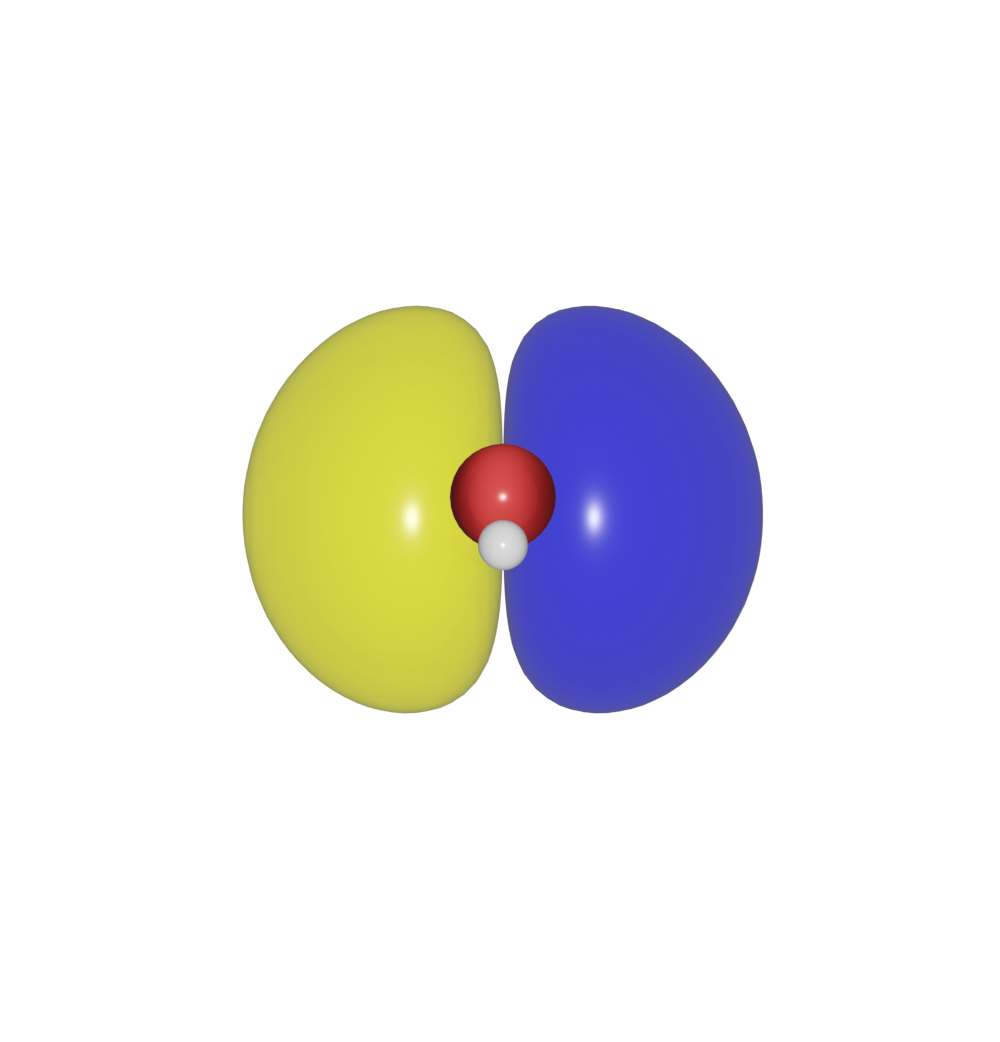
Cube file
Here we show a example of draw isosurfaces from cube file.
>>> from ase.io.cube import read_cube_data
>>> from batoms import Batoms
>>> volumetric_data, atoms = read_cube_data("../tests/datas/h2o-homo.cube")
>>> h2o = Batoms('h2o', from_ase = atoms)
>>> # add volumetric data
>>> h2o.volumetric_data['homo'] = volumetric_data
You can print the default setting by:
>>> h2o.isosurface.setting
Change the default setting by:
>>> h2o.isosurface.setting[1].level = 0.001
Delete a setting by:
>>> h2o.isosurface.setting.delete(1)
Add a new setting by:
>>> h2o.isosurface.setting[2] = {"level": -0.002, "color": [0, 0, 0.8, 0.5]}
>>> h2o.isosurface.draw()
The first value -0.002 is the level for the isosurface, the second value [0, 0, 0.8, 0.5] is the color. The last value of the color 0.5 is used to set the transparency.
The name of a setting can be any string, for example:
>>> h2o.isosurface.setting["negative"] = {"level": -0.002, "color": [0, 0, 0.8, 0.5]}
Note
If the atoms and the isosurface are not in the same place, probably because the cube file has a origin not at (0, 0, 0). Please read the origin and shfit the atoms:
>>> cube = read("test.cube", format="cube", read_data=True, full_output=True)
>>> volume = cube["data"]
>>> atoms = cube["atoms"]
>>> origin = cube["origin"]
>>> atoms.translate(-origin[0:3])
>>> h2o = Batoms("h2o", from_ase = atoms, volume = volume, draw = False)
CHGCAR
For calculation using VASP, the CHGCAR can be read by pymatgen, and then load the data into Batoms.
>>> from pymatgen.io.vasp.outputs import VolumetricData
>>> from batoms import Batoms
>>> # read CHGCAR
>>> poscar, data, data_aug = VolumetricData.parse_file('CHGCAR')
>>> # load structure and vlumetric data into Batoms
>>> batoms = Batoms('batoms', from_pymatgen = poscar.structure)
>>> # add volumetric data
>>> batoms.volumetric_data['chgcar'] = data['total']
>>> # set color and level for isosurface
>>> batoms.isosurface.settings["1"] = {'level': 14.0, 'color': [1, 1, 0, 0.9]}
>>> batoms.isosurface.draw()
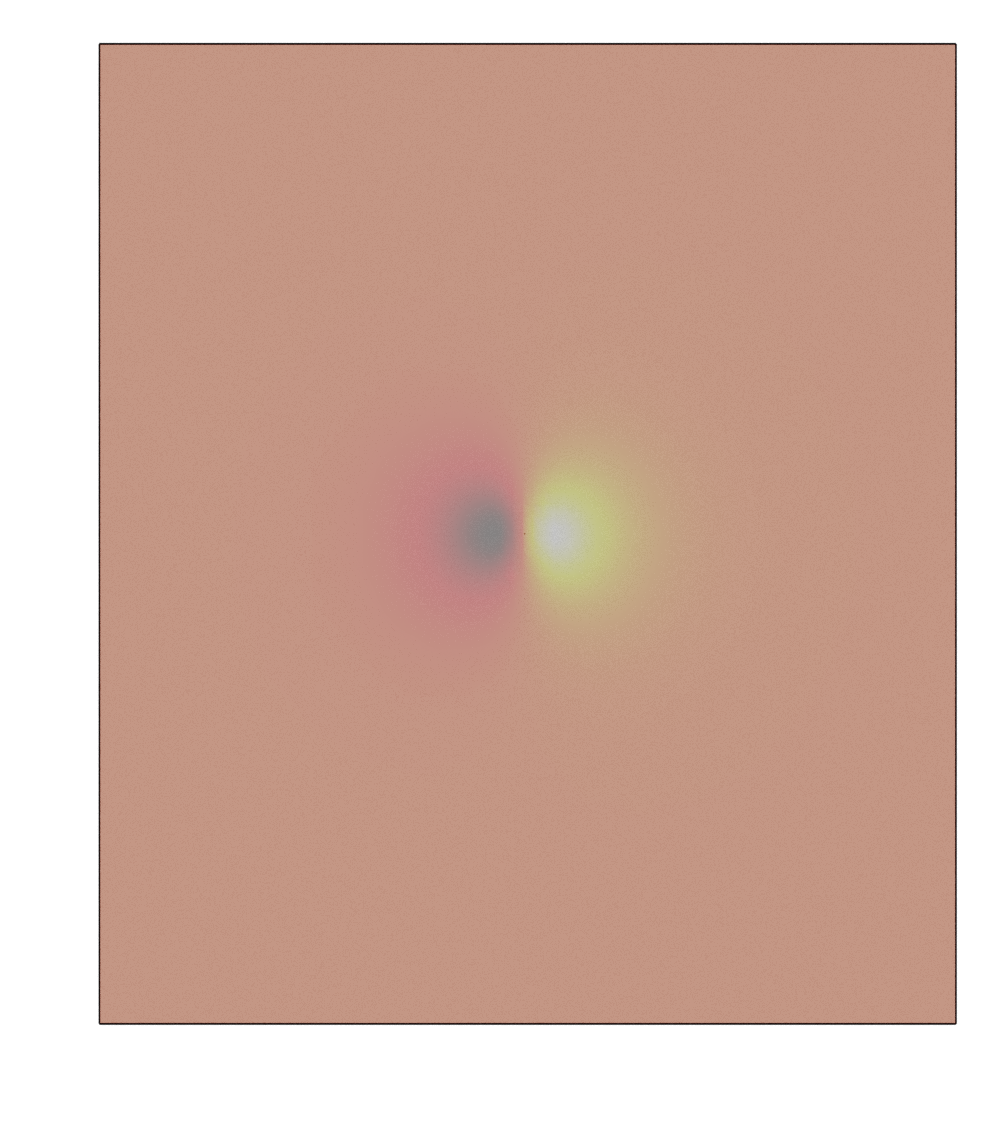
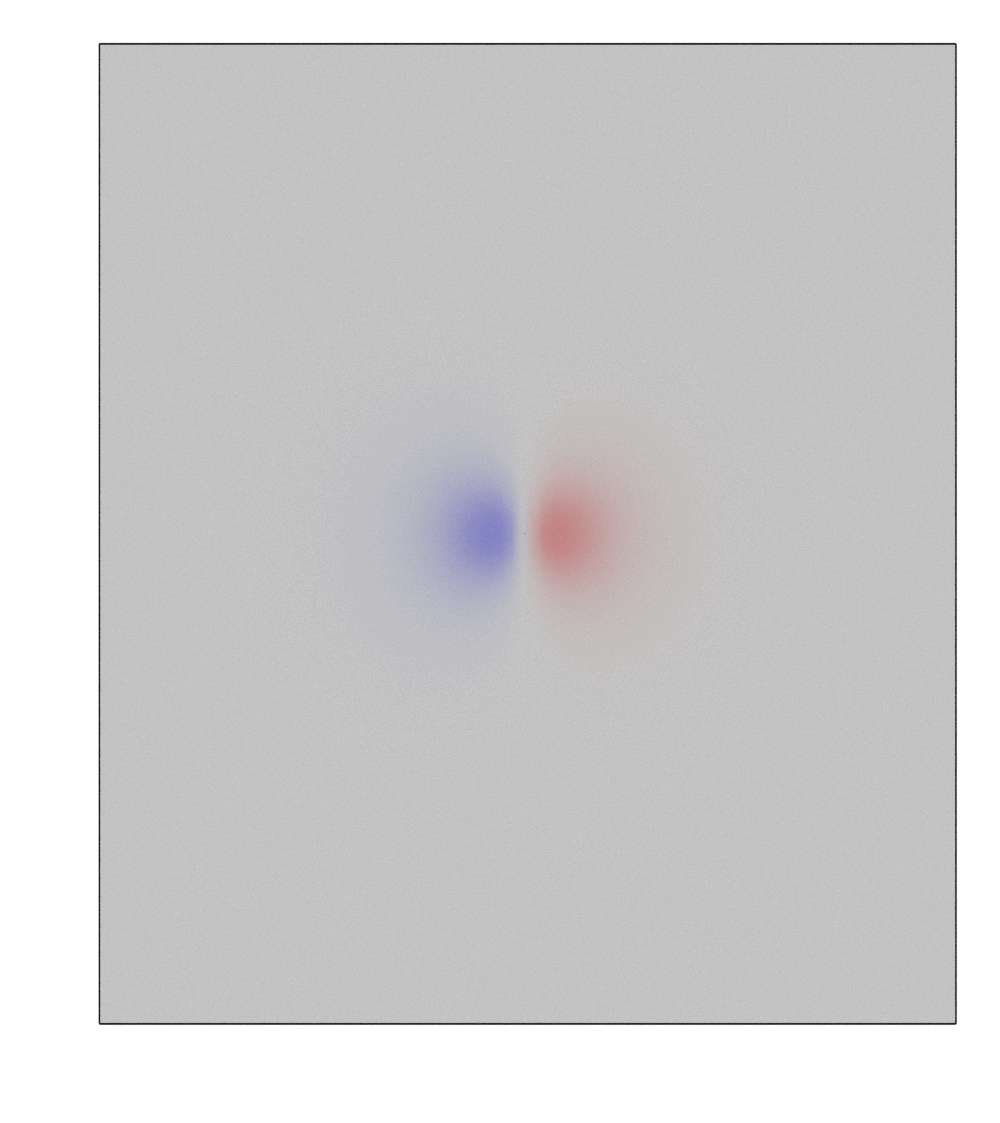
2D slicing
To add 2D slices of volumetric data in the model, add a plane with slicing as True.
>>> from batoms.batoms import Batoms
>>> from batoms.bio import read
>>> h2o = read("h2o-homo.cube")
>>> h2o.isosurface.setting.delete(1)
>>> h2o.isosurface.draw()
>>> h2o.lattice_plane.setting[(0, 0, 1)] = {"distance": 6, "slicing": True}
>>> h2o.get_image(viewport = [0, 0, 1], engine = "cycles")
Change render engine to EEVEE or CYCLES, and use viewport shading to see the colored plane.
Note
One can choose colormap by setting cmap. Please vist https://matplotlib.org/stable/tutorials/colors/colormaps.html to see the possible camp.
>>> h2o.lattice_plane.draw(cmap = "hot")